| |
elegans CYTOMER® û A database on anatomical/ histological knowledge
and gene expression extended to Caenorhabditis
Richard Ohnhäuser1, Martin Haubrock1, Claudia Böttcher1, Birger Vasel1, Birgit Lewicki-Potapov1, Ellen Fricke1, Stella Rotert1 and Edgar Wingender2
1BIOBASE Biological Databases GmbH, Mascheroder Weg 1b, D-38124 Braunschweig, Germany, e-mail: rio@biobase.de, mha@biobase.de, claudia.boettcher@stud.uni-hannover.de, bva@biobase.de, bpo@biobase.de, elf@biobase.de and sro@biobase.de, phone: +49-531-260-36-0, fax: +49-531-260-36-70
2GBF-Gesellschaft für Biotechnologische Forschung mbH, Mascheroder Weg 1b, D-38124 Braunschweig, Germany, e-mail: ewi@bgf.de, phone: +49-531-6181-427, fax: +49-531-6181-266
|
|
| |
|
Introduction
|
Thus far, several genomes, including the human genome, have been completely sequenced and the start of the "post-genomic era" or the period of "functional genomics" is now proclaimed. Systematic elucidation of gene function requires to link sequence data with information about molecular mechanisms, and also with histological, anatomical and even taxonomical data. As a consequence, even "classical" branches of biological and medical research gain interest when linked to genome-based information.
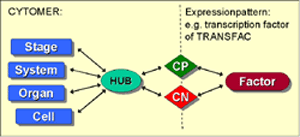 We have developed a relational database system called CYTOMER®, which aims at providing a comprehensive overview on all expression sources. Gene expression sources are organs, tissues, cell types in the different developmental stages of an organism. Therefore, CYTOMER® is a database about physiological systems, developmental stages, anatomical structures, substructures and the constituting cell-types (Wingender et al., 2000). The central table of CYTOMER® is a list called "HUB", that links entries of the four other tables. It represents anatomical/ histological knowledge about which cells occur with what kind of function in which organs and at what stages (figure 1). We have developed a relational database system called CYTOMER®, which aims at providing a comprehensive overview on all expression sources. Gene expression sources are organs, tissues, cell types in the different developmental stages of an organism. Therefore, CYTOMER® is a database about physiological systems, developmental stages, anatomical structures, substructures and the constituting cell-types (Wingender et al., 2000). The central table of CYTOMER® is a list called "HUB", that links entries of the four other tables. It represents anatomical/ histological knowledge about which cells occur with what kind of function in which organs and at what stages (figure 1).
|
| |
|
CYTOMER - C. elegans
|
| We extended CYTOMER®, which was previously restricted to human and mouse, with data of the nematode Caenorhabditis elegans (figure 2). This organism is a simple organized and well characterized metazoan (Wood et al., 1988). Since 1998 its entire genome sequence is known. As a special feature for CYTOMER® it is the first multicellular organism with a complete lineage map assignable to every cell for each stage of development. The 959 somatic cells of the adult represent most of the major differentiated tissue types including muscles (111 cells), neurons (302 cells), intestine (34 cells) and epidermis (213 cells). Furthermore, the complete invariant cell lineage shares many of the essential biological characteristics that are central problems of human biology. Over 50% of human gene sequences have a significant match to a C. elegans gene, making it an attractive model to study basic processes in human disease. |
| |
 Figure 2: The nematode Caenorhabditis elegans Figure 2: The nematode Caenorhabditis elegans
|
| |
|
Anatomical structures: organ and cell table
|
| The anatomical structures of C. elegans are illustrated in a hierarchical tree. We defined 12 organs on the top level of the hierarchy and 230 substructures. The corrsponding 959 somatic cells are linked to the lowest level of the hierarchy (figure 4). We also included the complete cell lineage, which describes the embryonic development of C. elegans. As an example the screenshot in figure 4 shows in an adult stage animal the 8 touch receptor cells, which are part of the nervous system. |
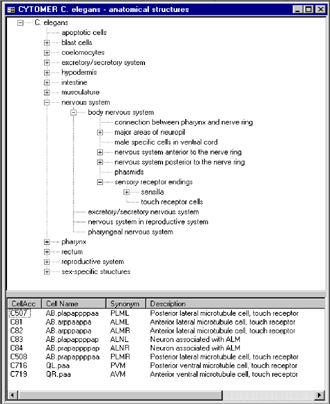
Figure 4: Hierarchical tree of anatomical structures in an adult stage C. elegans
|
| |
|
References
|
| Wingender, E., Chen, X., Hehl, R., Karas, H., Liebich, I., Matys, V., Meinhardt, T., Prüß, M., Reuter, I., Schacherer, F. (2000): TRANSFAC® an integrated system for gene expression regulation. Nucleic Acids Res. 28: 316-319
Wood W., B. and the Community of C. elegans Researcher (1988). The Nematode Caenorhabditis elegans. Cold Spring Harbour Laboratory Press |
| |
|
Web interface
|
| The web interface (see http://www.gene-regulation.com) was designed to enable the access to CYTOMER C. elegans from different points of view. It is possible to do a single query, which provides widespread information about a single topic as well as a combined search to get specific data about a more restricted context. The result of a single query string, e.g. "nervous system", is a detailed report of all entries including substructures and cells for different developmental stages by using the hierarchical structure of the database (see figures 3 and 4). On the other hand a more specified query provides a focus on special parts of C. elegans like "touch receptor" cells. If available, expression patterns are linked to cells or anatomical substructures. Up to now we use this system for presentation of given expression patterns concerning transcription factors (figure 5). As datasource we use the TRANSFAC® database, which includes about 100 transcription factor entries of C. elegans. In future it is planned to link all genes with known expression patterns to CYTOMER®. |
| |
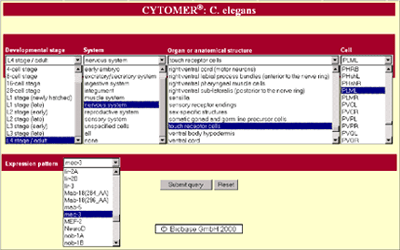
Figure 3: Web interface of CYTOMER C. elegans (see http://www.gene-regulation.com)
|
| |
|
Report of expression patterns
|
| The query of a single gene results in a tabulated report of expression patterns, which includes both temporal and spatial patterns. See figure 5 for examples. |
| |
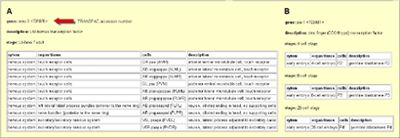
transcription factors mec Figure 5: Expression pattern of the -3 (A) and pie-1 (B)
|
| |
|
Visualization of expression patterns
|
| On the basis of the CYTOMER® data, expression patterns could be visualized by generating dynamic images on where the corresponding structures are marked. As an excample figure 6 shows the expression profile of the two transcription factors pie-1 and mec-3 (data source: TRANSFAC® database). |
| |
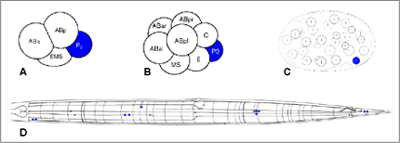
Figure 6:
A, B, C: expression of pie-1 in a 4-, 8- and 28-cell stage embryo
D: expression of mec-3 in an adult stage animal
expression in marked with blue color
|
| |
 We have developed a relational database system called CYTOMER®, which aims at providing a comprehensive overview on all expression sources. Gene expression sources are organs, tissues, cell types in the different developmental stages of an organism. Therefore, CYTOMER® is a database about physiological systems, developmental stages, anatomical structures, substructures and the constituting cell-types (Wingender et al., 2000). The central table of CYTOMER® is a list called "HUB", that links entries of the four other tables. It represents anatomical/ histological knowledge about which cells occur with what kind of function in which organs and at what stages (figure 1).
 Figure 2: The nematode Caenorhabditis elegans


